Skip to content

Supply lines under pressure, people working remotely, frontline workers in the fray… workplace communication streams are fractured. There has never been a more critical time to alleviate gaps in understanding. But that’s going to take more than “data:” companies today are swimming in that. The colossal task you may face is transforming all that information into actionable intelligence for use in driving your business.
Real-time business intelligence is what’s needed to combat disruptions, inform staff, and maintain productivity. Most operational systems such as workforce management, asset management, inventory, shipping, and customer service all have some type of business intelligence that corresponds to their function, helping to streamline processes that can improve business results. A Business intelligence dashboard aggregates these disparate data and performance indicators to give a holistic view on all those systems working together to drive desired outcomes. Are you ready to improve processes, programs, and the bottom line using the power of insight?
Reports vs. Dashboards
What’s the Problem with Reports?
Executives have traditionally used reports to drive decision making from their boardroom huddles. A problem here is that many reports of this type are single topic, and particularly complex reports often depend on an undue amount of comparative data analysis. Each type of report (or a combination of both) may then require yet other reports with their own performance KPIs before the true critical information is finally revealed! Further complicating matters: reports are only delivered periodically to managers. This means the data being reported is based on the past and may lack immediate relevancy to the latest situations — leading to dated decision making.
What is a Business Intelligence Dashboard?
A business intelligence dashboard is a business tool that aids in visualizing specific data and Key Performance Indicators (KPIs), to provide insight into operational performance of projects, teams, or the organization. Typically, these are dynamic, live data streams that update in real-time to display visual data, illustrating minute-by-minute changes to performance.
Dashboards can focus on narrow operational aspects — or multiple sources can be combined for broad, comprehensive views into whole units. For example, a production manager may have specific dashboards devoted to inventory, shipping, receiving and workforce management KPIs. But a contact center supervisor may want to see a single view that brings together average call times, customers in queue, and escalation incidents.
As the world has come to rely on Just-in-Time (JIT) delivery to eliminate waste, companies can no longer rely on static information to keep production moving. Real-time data points updated perpetually and presented in combinations aligned to your project needs will keep you ahead of the competition, route you around that sudden obstacle, and give you a jump on the next opportunity.
Features of a Business Intelligence Dashboard
The factors and KPIs that go into a business intelligence dashboard are specific to the goals of the organization and the desired beneficial insights needed to formulate decisions. Look for your modern BI dashboard platform to include all these features:
- Custom Interface– The ability to manipulate the screen placement of different data points proves important in highlighting certain metrics to achieve desired performance.
- Real Time Data Capabilities– An effective dashboard should connect easily with multiple different systems to update information as it changes.
- Accessibility – Performance in today’s business climate requires the ability to gain insight from any location and device.
- Interactivity– BI Dashboards deliver when they can draw on deep levels of comparability, such as assigned date ranges or segmented line performance
- Targeting – Relaying the right information to the intended recipient, with the added ability to share the results of that targeted action.
Benefits of Dashboards in Business
Business intelligence dashboard interfaces visualize data summaries to provide real-time insights into multiple areas of business operations. These “at-a-glance” views bring many significant benefits, including:
- Visibility – With all available information at your fingertips, dashboards ensure your ability to respond to changing business needs.
- Timesaving – The automated nature of dashboards saves time and creates efficiencies by eliminating the need for constant generation of reports.
- Forecasting – Predicting future demand is simplified using historic data analysis from previous purchase cycles.
- Inventory control – Real time views into inventory stock levels help manage waste and loss, while simplifying the ordering process.
- Realtime analytics – Live views of metrics as they change allows for quick course correction when needed.
- Collaboration support – Sharing information with constituents and stakeholders keeps teams aligned and helps drive better business outcomes.
Operational, Analytical, or Strategic Dashboards – Which is right for you?
With so many combinations of data connections, it can be difficult to understand where to use all that information in ways that drive business results. All the possible combinations will basically boil down to one of three dashboard categories.
- Strategic – Composed of high-level metrics providing longer term views into business operations.
- Operational – Comprised of operational metrics viewed in shorter timeframes for quick decision making.
- Analytical – Traditionally for analysts and are comprised of large amounts of data visualization.
Strategic Dashboards: The Barometer of Success
Setting goals and striving to achieve them is the baseline for success in any endeavor. Defining key performance indicators and tracking those in relation to actual performance is the foundation for the type of KPI dashboard known as a strategic dashboard. This type of dashboard is used to align business units to corporate objectives. One example would be an outbound contact center where business development representatives (BDRs) have target call volumes to meet. In this instance, the BDR’s strategic dashboard would feature target conversion numbers balanced with staffing capabilities to drive maximum performance of each team and work shifts.
Operational Dashboards: The Window to Business Performance
Manufacturers and supply chain operations utilize numerous monitoring and control systems. While these have insight critical to the overall operations of the facility, they are another instance of often disconnected systems Here is where operational dashboards bring all these metrics together for a holistic view of intake, inventory, manufacturing, and distribution processes with a minute-by-minute ability to evaluate and alter process in ways that maximize daily performance.
Analytical Dashboards: The Past Indicates the Future
Identifying trends that affect performance is an ongoing challenge for most businesses. Aggregating the information needed to make important decisions requires more than top level KPIs: it requires the ability to drill down and compare specific date ranges to understand if performance outcomes line up with implemented actions. One example of this is a marketing dashboard that analyzes the performance of numerous campaigns, measured against objectives for any period in time. Analytical dashboards are typically quite complex, in order to handle the range of comparisons needed by an analyst and the senior level executives who are creating a roadmap for company operations.
Examples of BI Dashboards
Organizations often employ numerous dashboards to support decision-making processes at every level of an organization. Here are some examples of the BI dashboards designed for different departments and functions.
Sales Dashboards
The most common use for data dashboards in the executive suite, these typically include product sales data, departmental operational expenses, and KPIs around pipeline flow that enable sales team managers and department heads to track deals against forecasted goals.
Financial Dashboards
From assets and liabilities to operating expenses and profits, this dashboard delivers the KPIs on the fiscal health of an organization for executives and the finance team to monitor business performance in terms of cash flow.
Marketing Dashboards
Interpreting marketing success is driven by the correlation of leads generated against program or campaign expenses, and can include metrics like open rates, conversion rates and costs.
IT Dashboards
IT departments are usually the largest users and managers of infrastructure, monitoring aspects of various applications, networks, and databases to help track numerous performance metrics on all aspects of IT operations.
Supply Chain Dashboards
Digital signage for supply chains incorporates line management, product inventory, personnel management, and distribution are a few of the many metrics needed to keep supply chains moving, allowing managers to spot problems and keep products flowing through the operation.
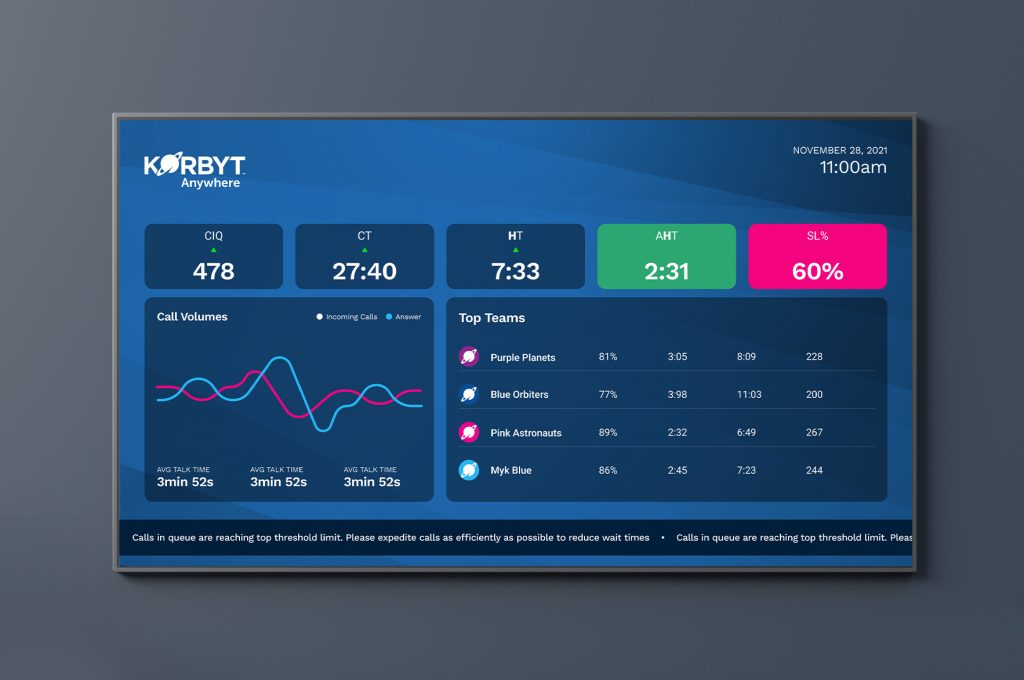
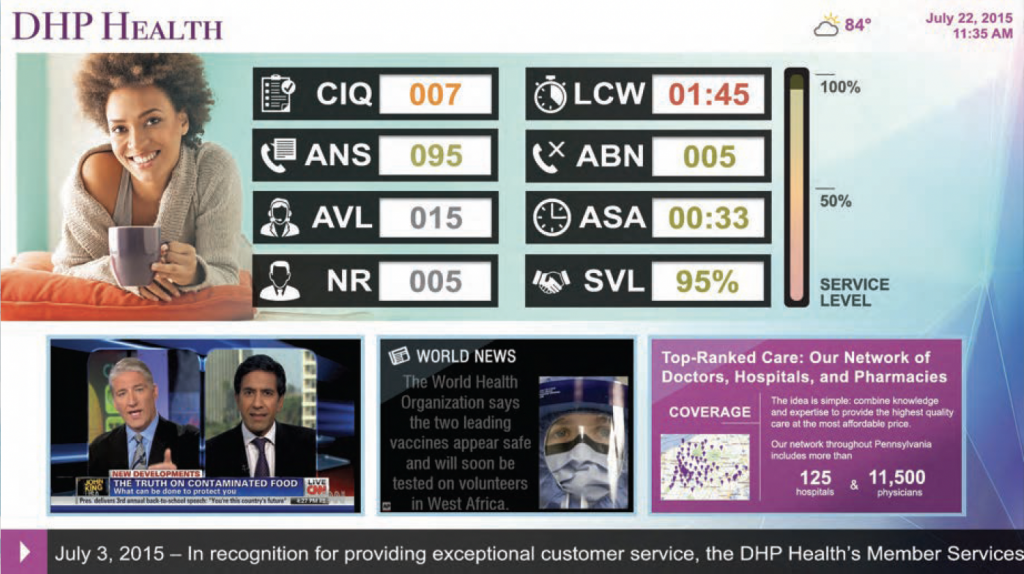
Contact Center Wallboards and Dashboards
Call Center Wallboards displaying calls-in-queue or real time sales report to agents on the contact center floor elevates team productivity and drives results; while “roll up” dashboards for supervisors helps to outline and guide the overall team performance.
What’s next for all your data? If it’s not easy to access, analyze and understand — it’s just another expense to the operation. Put your money where it generates results. A business intelligence dashboard transforms data and information into situational awareness that powers decisions to align operations, increase engagement, and drive greater productivity.