Skip to content


Communicate, Evaluate, and Motivate Call Center Agents
Average speed of answer. First call resolution. Net promoter score. Call abandonment rate. Customer effort scores.
Lions and tigers and percentage-of-blocked-calls, oh my.
Welcome to just a fraction of what needs to be measured and acted on in your call center. It’s a stressful, rapid whirlwind of data , expectations and abilities. At the center of the swirl is your call center manager. How you empower that individual will make all the difference between getting spun around — and transforming that manager into the calm in the storm, providing exceptional experience for agents and the customers seeking support.
Calculating and improving the performance management of contact center agents is based on many factors and can spread out across many activities. This is where a modern workplace experience platform can also power a performance management system: providing a centralized data dashboard that brings together the key metrics, and enables the targeted follow ups to engage agents, and improve productivity and performance for the company.
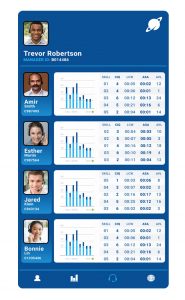
The Dashboard to Call Center Success

Think of your car’s dashboard. Dials, gauges, indicators — increasingly digital in nature, with multiple layers of data. Fuel, speed, engine condition, tire pressure — plus warning alerts that flash when there’s trouble or needed service. But a single glance will tell you whether you’re going to get to your destination safely and on time.
Expect the same benefits from your call center performance management dashboard. Quick access to critical KPIs — key performance indicators — of the business will help managers decide whether agents or the center is on track to meet company goals.
There are potentially two sides to a KPI dashboard: operational and strategic. On the operational side (or screens) are the day-to-day processes, issues and outputs that are an overview of what is running smoothly and what needs fixin’ before it becomes a real problem that affects employee performance. For call centers, this is the number of phone calls, the average wait time on hold, and a host of other critical data-in-motion. On the strategic side the data is represented to help your manager look to the future: how are Total Calls Handled, Average Speed of Answer, and Occupancy Rates helping to identify obstacles and challenges that may affect goals and continued success for call centers?
As these KPIs often interrelate, displaying them alongside each other is a way to instantly see where goals are being met and which priorities may need to be adjusted. There may even be options to simulate adjusting certain parameters to explore scenarios to increase effectiveness. (Of course, real world may not always play out that way!) The immediate benefit is an instant communication of where the call center is on target and how that impacts the call center’s overall performance. It is using data to tell a story that helps your manager, agents and customers get what they need.
User Experience > Performance Anxiety
To get more value from your data, you’ll want to look for a employee communications platform with abilities that are going to leverage the best design principles of UX — User Experience. This is critical for a visual performance dashboard, to ensure that the massive amounts of information being generated by customer calls and agent interactions results in something understandable and actionable: the right data to the right person at the right time. Consider these qualities when evaluating your platform:
- Simplicity: Less is assuredly more in this case. Filling a screen edge-to-edge with information may seem tempting and even efficient, but it is useless if you can’t tell at a glance what you’re seeing. Avoid clutter, embrace scannability.
- Contrast & Color: Your managers or agents may have limited range of color vision, so look for displays that use shapes and contrast that stand out to be sure each is seeing the data everyone needs.
- Visual Cues: Guide the eye and action with clear indicators that show when screen elements include contextual information or link to another screen, and whether buttons are active or inactive.
- Hierarchy of Information: Your dashboard should show data in the order of importance, so what matters most displays first. Many people “F-scan”: horizontally across the screen, and then down. Consider how your dashboard presents information to maximize what managers and agents can do with it.
In the moment, your managers will benefit most from performance management dashboards that include only the most insightful KPIs needed to achieve their operational and strategic goal setting.
A Performance Management System for Measurement
There are many measurable factors that your call center will need to track in order to maximize its performance management programs. Cold, hard data provides an active view into customer satisfaction and employee performance management, making it easier for you to identify weak spots within your call center — as well as individuals and activities to champion.
Your performance management system should be able to give your manager and agents a way to review these as visualized data — a common framework for teamwork and accelerating the advance of response time and productive engagements with customers. Bear in mind that not all metrics are made alike. You’ll want to focus on the ones that align with your core objectives:
Call Arrival Rate: The average number of incoming calls, commonly calls per minute or calls per hour.
Total Calls Handled: The total number of calls your call center handles in a day, “handled” being if the agent answered and had a customer conversation
Percentage of Calls Blocked: Number of customers receiving a busy signal when placing a phone call to your center.
Call Abandon Rate: The percentage of customers who hang up before connecting with an agent.
First Response Time (FRT): Time between customer making an inquiry and agent responding.
First Call Resolution (FCR): Indicating your call center’s ability to resolve a customer issue the first time they call in.
Average Speed of Answer (ASA): How long it takes an agent to answer a call once routed to the call center.
Average Handle Time (AHT): The average time it takes for an agent to complete a customer interaction call. This includes the customer wait time before the call, and any post-call admin tasks required by the agent.
Occupancy Rate: The percentage of an agent’s available time that is being spent with callers.
Service level: Ratio of call answered in a given time. For example, 80/20 = 80 calls answered within 20 seconds.
There are also metrics related to customer satisfaction, which can also be displayed and factor into both operational and strategic achievements.
Customer Effort Score (CES): The effort customers must exert in order to get an issue resolved, a question answered, or a request fulfilled, most effectively determined with a survey ranking on a seven-point scale ranging from “very difficult” to “very easy.”
Customer satisfaction score (CSat): These customer ratings of their experience with an agent are often on a seven-point scale from “very unsatisfactory” to “very satisfactory.”
Net promoter score (NPS): Assess customer experience and loyalty by asking them to rank from 0-10 how likely they would be to recommend your business.
Performance Management Programs in Action
Dashboards and KPIs will only take performance management programs so far. How you put them to work across your call center and with your agents is central to achieving success. Your dashboard is more than a display. It is a learning tool for broader engagement that help agents to train, improve and stay motivated. In many instances, it may also be tied into a full workplace experience platform that can publish targeted content to agents as individuals or teams.

Test for quality assurance. Call monitoring in combination with performance management systems can demonstrate the qualities you’re looking for in agent performance and customer satisfaction: adherence to call center script, call center protocol and etiquette and problem-solving capabilities. Monitoring may also include automated speech analytics to identify issues and opportunities across large volumes of agent/customer interactions. This is not only to correct mistakes, but also to understand agent behavior, refine scripts, and develop agent training that helps support individual and team improvement in a continuous manner.
Develop and promote a centralized knowledge base. Having frequently asked questions, next steps, and call scripts for common (and uncommon) scenarios at the ready is a powerful, proactive way to support agent interactions with customers. These can be accessed by agents, or served up by managers on an as-needed basis through the dashboard system — eliminating wait times and leading to more customer satisfaction. When managers can “push” call scripts tailored for adverse situations, that can help ensure agents continue to project positive language. This can also help agents to view customer complaints not as obstacles, but as an opportunity to provide great service. Soliciting feedback from agents on their regular customer conversations can extend this base of best practices from individuals to an entire team.
Empower your agents. Providing agents with access to the same data helps establish common goal performance standards. A modern workforce communications platform will provide for targeted displays on each agent’s screen, both on premise and remote, customized for individual and broader team metrics. Agents are then better empowered to make decisions on achieving those goals, enabling single call resolution and a more positive customer experience.
Celebrate & Incentivize. Setting quotas, contests and rewards tied to performance metrics are great ways to enhance call center performance. They keep people motivated when calls get tough. Even more, they can help maintain a high level of morale for a team and make individual agents feel more appreciated. Appreciated employees are more likely to extend themselves to deliver the top customer service you want your call center to be known for. (Gallup reports that 69% of employees would work harder if they were better recognized.)
Give Your Contact Center the KPI Edge
What CSat would you give your call center? If it’s anything less than “very satisfactory”, consider the ways dashboards and data can transform your operations as part of an overall performance management system. Translate those KPIs from complex and disparate into an understandable, actionable format: filtered, organized, analyzed, visualized.
As the saying goes, “What gets measured gets done.” But it’s more than the numbers. If your people only focus on quantity, you may fail on call quality. When a customer contacts your call center, they want your people to care. The “done” in the case of your call center is winning over your customers. Manage for performance that takes your entire agent and customer experience forward: operationally, productively — and empathetically.